Electrify Chicago
An independent tool for viewing City of Chicago building data
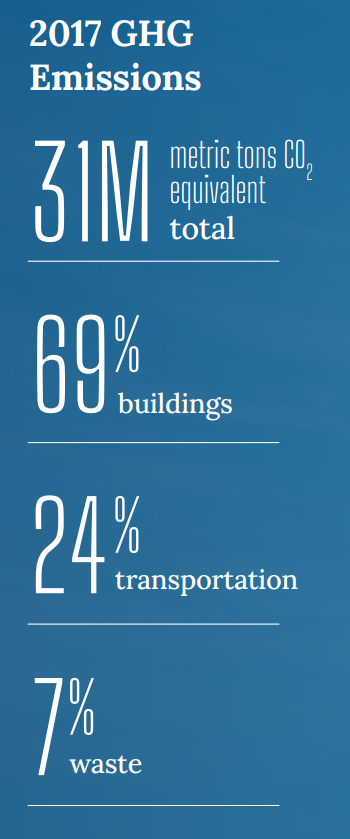
According to the
2022 Chicago Climate Action Plan ,
69% of Chicago's emissions come from buildings, making
building emissions our biggest challenge and our biggest opportunity as a city
to tackle climate change. At Electrify Chicago, we showcase building performance using
publicly available data supplemented by community-submitted photographs and building
owners.
,
69% of Chicago's emissions come from buildings, making
building emissions our biggest challenge and our biggest opportunity as a city
to tackle climate change. At Electrify Chicago, we showcase building performance using
publicly available data supplemented by community-submitted photographs and building
owners.
Start by looking at Chicago's buildings with the highest greenhouse gas intensity i.e. emissions per square foot. Large, efficient, buildings can perform much better than very inefficient small buildings on this metric.
New Article
📰 $30 Million In Missed Fines
The City Of Chicago failed to collect $30 million in potential fines from the building benchmarking ordinance, reducing transparency and accountability.
Legislative update! 🎉
As of late January 2024, legislation is being introduced to require new use more efficient forms of water and space heating, via the Clean And Affordable Buildings Ordinance (CABO), which will reduce the number of highly polluting and inefficient buildings that end up on this site.
If you're in Chicago,
write to your alderman to support the CABO!
Chicago Buildings by Greenhouse Gas Intensity
Note: Data includes large Chicago buildings with data from 2022, unless explicitly stated otherwise.
Note: This data only includes buildings whose emissions are reported
under the
Chicago Energy Benchmarking Ordinance. According to the City “As of 2016,
this list includes all commercial, institutional, and residential buildings larger than
50,000 square feet.” This dataset is also then filtered to only buildings with
reported emissions > 1,000 metric tons CO2 equivalent.
The latest year of data is from 2022, but we update the site regularly when new data is available, and some buildings may have failed to report that year, and only have older data available.
| Property Name / address | Primary Property Type |
Greenhouse Gas Intensity (kg CO2 eq./sqft) |
Total Greenhouse Emissions (metric tons CO2 eq.) |
|---|---|---|---|
|
Bernard Mitchell Hospital
🕰️
5815 S Maryland Ave
| Hospital (General Medical & Surgical) | 27.9 kg/sqft | 12,008 tons |
|
53100522--CHICAGO
🕰️
5201 Sheridan Rd
| Supermarket/Grocery Store | 27.8 kg/sqft | 1,533 tons |
|
McLean
🕰️
5824 S Ellis Ave
| Laboratory | 27.7 kg/sqft | 3,090 tons |
|
WEISS MEMORIAL HOSPITAL
🕰️
4646 N MARINE DR
| Hospital (General Medical & Surgical) | 27.7 kg/sqft | 11,410 tons |
|
Pete's Kedgie
🚩
4700 S Kedzie Ave
| Supermarket/Grocery Store | 26.8 kg/sqft #22 Highest
| 1,445 tons
Highest 33%
|
|
Roscoe Square/ 90034
🕰️
3330 N Western Ave
| Supermarket/Grocery Store | 26.7 kg/sqft | 1,372 tons |
|
Anatomy and Culver
🕰️
1027 East 57th Street
| Laboratory | 26.3 kg/sqft | 1,764 tons |
|
303 E Superior Street
🚩
(Northwestern)
303 E Superior Street
| Laboratory | 26.2 kg/sqft #23 Highest
| 10,967 tons
Highest 2%
|
|
53100539 -- Chicago
🕰️
3857 S DR MARTIN L KING JR DR
| Supermarket/Grocery Store | 26.2 kg/sqft | 1,886 tons |
|
Washington Park Fieldhouse, Trades, DuSable Roundhouse
🕰️
5531 South King Drive
| Museum | 26.2 kg/sqft | 3,211 tons |
|
Jewel at South Loop Marketplace
🚩
1340 S CANAL ST
| Supermarket/Grocery Store | 26.0 kg/sqft #24 Highest
| 1,858 tons
Highest 25%
|
|
CME Group Inc
🕰️
333 S LaSalle St
| Financial Office | 26.0 kg/sqft | 6,781 tons |
|
Lurie Children's Lincoln Park Outpatient Center - Deming
🚩
467 W Deming Pl
| Mixed Use Property | 25.8 kg/sqft #25 Highest
| 1,623 tons
Highest 29%
|
|
Jewel Osco, 03181-87th & State St
🚩
87 W 87th St
| Supermarket/Grocery Store | 25.2 kg/sqft #26 Highest
| 1,766 tons
Highest 26%
|
|
Shop & Save Market - Archer
🕰️
5829 S Archer Ave
| Supermarket/Grocery Store | 25.1 kg/sqft | 1,688 tons |
Data Source:
Chicago Energy Benchmarking Data